Sankey Diagrams & Sustainability Measures for Main Alloy Groups
Review · Nature 575, 64–74 (2019) · DOI: 10.1038/s41586-019-1702-5
Motivation
Iron, aluminium, nickel, and titanium are the four most-used structural metals. Together they underpin global infrastructure, transport, energy, and safety. Production is energy- and carbon-intensive, and demand is forecast to rise by up to 200% before 2050 — driving an urgent need for sustainability strategies across the full value chain.
Scale of the challenge
- Global metals market: ~€3,000 billion yr⁻¹
- Energy consumption: ~53 EJ yr⁻¹ ≈ 8% of global primary energy
- CO₂ emissions: 4.4 Gt CO₂eq yr⁻¹ (steel + Al combined)
- Tailings waste: 2,400 Mt yr⁻¹ from steel and Al; 160 Mt yr⁻¹ bauxite residue
Demand outlook
- Production growth predicted: up to +200% by 2050
- Urbanisation: >60% of population in cities by 2025
- Available post-consumer scrap falls short of demand by ~one-third until at least 2050
- Sustainability must address the entire value chain, not only primary production
Four Key Structural Metals — Snapshot (2017 data)
|
Metal |
Production (Mt yr⁻¹) |
Energy (EJ yr⁻¹) |
CO₂ |
Mfg. scrap fraction |
Primary end use |
|---|---|---|---|---|---|
|
Iron & Steel |
1,700 |
40 |
3.7 Gt yr⁻¹ |
25% |
Construction 55% |
|
Aluminium |
94 |
13 |
0.7 Gt yr⁻¹ |
40% |
Transport 27% |
|
Nickel |
2.1 |
0.25 |
26 Mt yr⁻¹ |
20% |
Industrial machinery 30% |
|
Titanium |
0.2 |
0.07 |
6.7 Mt yr⁻¹ |
60% |
Aircraft 75% |
Source: Table 1, Raabe et al., Nature 575 (2019). Mfg. scrap = manufacturing/processing scrap fraction.
Material Flow Analysis: Sankey Diagrams of Metal Flow
The Sankey diagrams below trace each metal from mine through processing, manufacturing, and use to end-of-life. Flow width is proportional to mass. All figures from Raabe et al., Nature 575 (2019).
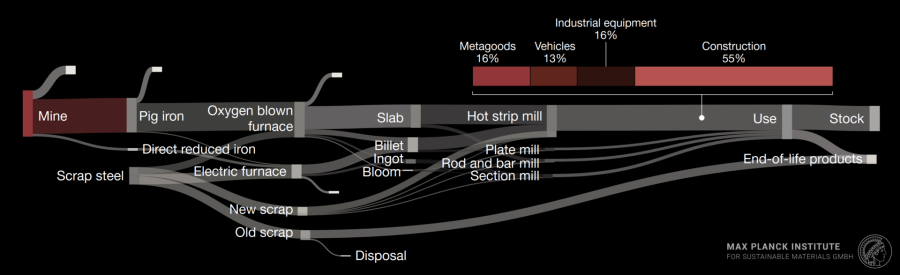 Fig. 1 — Sankey diagram Iron & Steel. Construction 55% · Vehicles 13% · Industrial equipment 16% · Metagoods 16%.
Key Findings from the Sankey Diagram for Iron & Steel
- Dual production route: blast furnace (pig iron) + electric arc (scrap)
- 45% of steel already produced from scrap
- Construction: 55% of end use — long in-use stock delays end-of-life scrap return
- New scrap and old scrap both recirculated; small disposal fraction persists
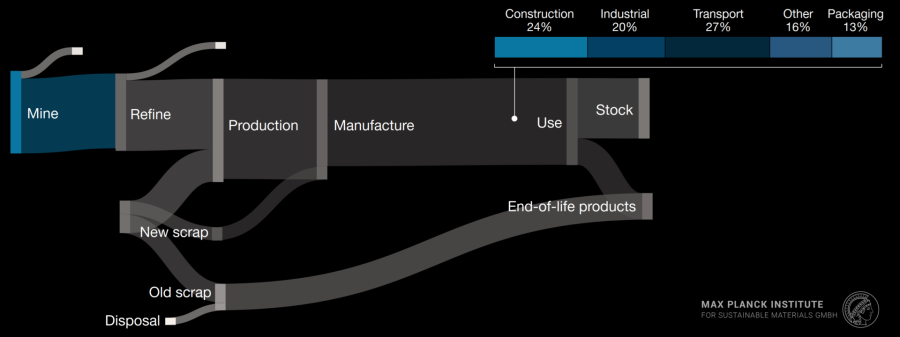 Fig. 2 — Sankey diagram Aluminium. Transport 27% · Construction 24% · Industrial 20% · Packaging 13%.
Key Findings from the Sankey Diagram for Aluminium
- Manufacturing scrap: 40% — highest of the four metals
- Transport and construction together: 51% of end use
- Old scrap loop visible but limited; Cu and Fe contamination restricts wrought-to-wrought recycling
- Electrolysis energy dominates primary CO₂ footprint
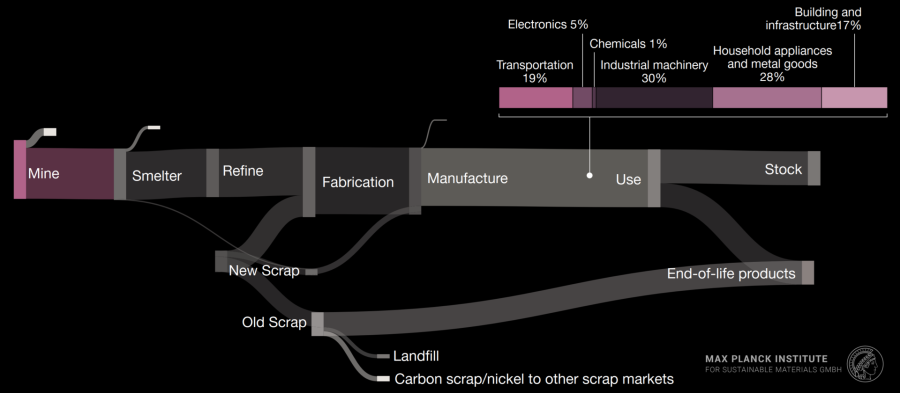 Fig. 3 — Sankey diagram Nickel. Industrial machinery 30% · Household & metal goods 28% · Transportation 19% · Building 17%.
Key Findings from the Sankey Diagram for Nickel
- ~two-thirds of Ni used as alloying element in stainless steel
- Industrial machinery: 30% of end use
- 20% of post-consumer Ni scrap lost into carbon/copper scrap streams
- Landfill and cross-market losses clearly visible in the Sankey
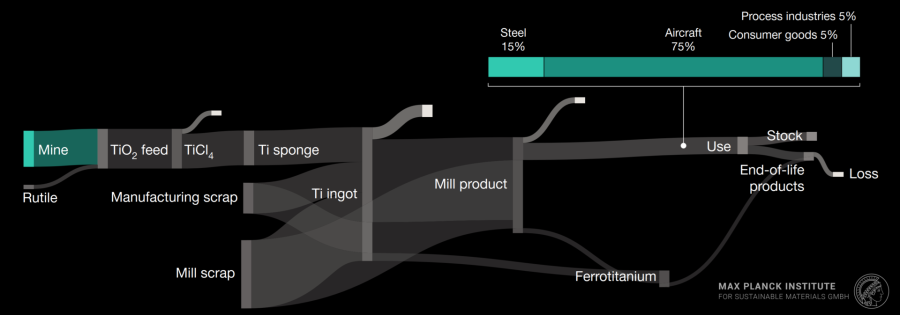 Fig. 4 — Sankey diagram Titanium. Aircraft 75% · Steel additive 15% · Process industries 5% · Consumer goods 5%.
Key Findings from the Sankey Diagram for Titanium
- Aircraft: 75% of end use — long service life delays scrap return
- Manufacturing scrap: 60% — highest loss fraction at processing stage
- Route: rutile → TiO₂ → TiCl₄ → sponge → ingot → mill product
- Virtually no post-consumer recycling; scrap diverted to ferrotitanium
Cross-cutting observation: For all four metals, demand will exceed available post-consumer scrap by approximately one-third until at least 2050. The in-use stock is still growing — end-of-life scrap will not close the gap without simultaneous reduction in primary production intensity.
Strategies Along the Value Chain
Pathways to Sustainability
1 — CO₂-Reduced Primary Production
- H₂-based direct reduction of iron ore (H₂-DRI): up to −50% CO₂ vs. conventional blast furnace; market entry ~2030
- H₂ injection into blast furnace gas mix: commercially implementable now as interim measure
- Electrolytic iron synthesis (molten oxide electrolysis): zero-CO₂ route; pilot scale, not before ~2040
- Aluminium: primary lever is switching Hall–Héroult electrolysis cells to renewable electricity
- Reducing manufacturing yield losses (steel 15%, Al 25%) offers near-term CO₂ savings
2 — Recycling and Scrap-Compatible Alloy Design
Scrap Sorting & Separation
- LIBS and XRF spectroscopy enable alloy-specific scrap identification at industrial throughput
- Within-alloy-family recycling minimises compositional downgrading
- Al: Cu and Fe contamination critical for wrought grades
- Ni: 20% of scrap lost to C-steel streams — improved separation essential
Recycling-Oriented Alloy Design
- Design alloys tolerant to multi-element scrap inputs
- Crossover (broadband) compositions: one alloy serves a wider application range
- Microstructure tuning instead of composition over-alloying
- Multi-component thermodynamics (up to 20 elements) required for reliable prediction
3 — Longevity and Re-use
- Corrosion costs: ~3.4% of global GDP (~US$2.5 trillion yr⁻¹)
- Protective coatings, sacrificial anodes, and self-passivating alloys extend service life
- Hydrogen embrittlement is a key risk for high-strength steels (>650 MPa) in H₂-economy applications
- Microstructure reset (heat treatment) enables remanufacturing and re-use of structural components
4 — Lightweighting and High-Temperature Efficiency
- ~12% of steel and ~27% of Al are used in transportation — key lightweighting sector
- Up to 30% mass reduction achievable via TRIP/TWIP steels, Al–Li alloys, Mg alloys
- Higher turbine inlet temperatures → better Carnot efficiency → less fuel per unit power
- Ni/Co-superalloys, Ti-aluminides, and Mo–Si–B alloys are the key high-temperature material systems
Priority Recommendations
Near-Term · Available Now
Implement Immediately
- Fossil-free / renewable energy in primary and secondary production
- Improved corrosion protection — largest longevity lever
- Reduce manufacturing scrap losses
- Waste heat harvesting for electricity
Medium-Term · ~2025–2035
Scale Up
- H₂-based direct reduction of iron ore at industrial scale (~2030)
- Automated scrap sorting (LIBS, XRF) across supply chains
- Within-alloy-family recycling as standard practice
- Thin-slab and thin-strip casting for steel and Al
Far-Term · Research Stage
Develop & Deploy
- Electrolytic iron synthesis — molten oxide electrolysis (not before ~2040)
- Crossover alloys for mixed/contaminated scrap streams
- Digital material traceability and re-use infrastructure
- Medium- and high-entropy alloys as impurity-tolerant systems
"Striving towards sustainability will become the next industrial revolution."