Introduction to the Thermodynamics of Steels: The Iron Carbon Phase Diagram
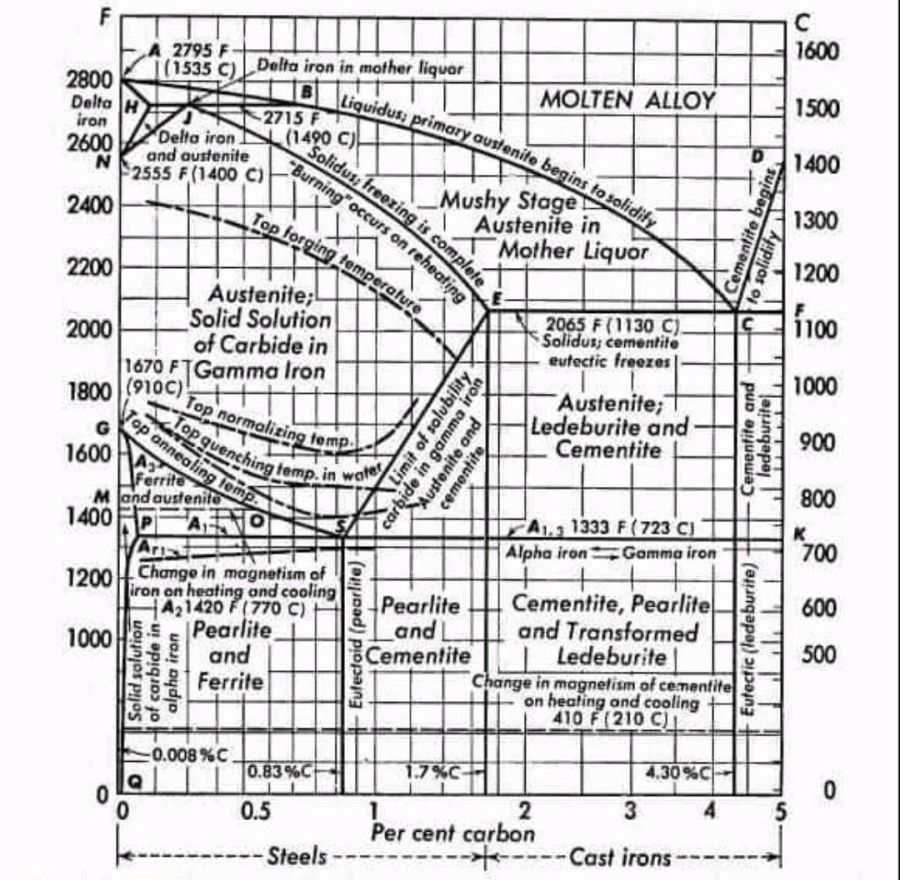
The iron-carbon phase diagram represents the non-equilibrium phase relationships in iron-carbon alloys containing up to 6.67 wt% carbon, corresponding to the stoichiometric composition of cementite (Fe₃C). Note that the true thermodynamic equilibrium phase diagram of iron and carbon does NOT include cementite but graphite as a stable phase. Yet, this phase very rarely forms.
Therefore, steels are usually developed based on the metastable form of that phase diagram of iron and carbon.
The metastable diagram, established over more than 100 years through systematic thermal analysis, quantum mechanical calculations, basic thermodynamic Gibbs phase analysis, and microstructural characterization, serves as the fundamental thermodynamic framework for understanding phase transformations in steels and cast irons.
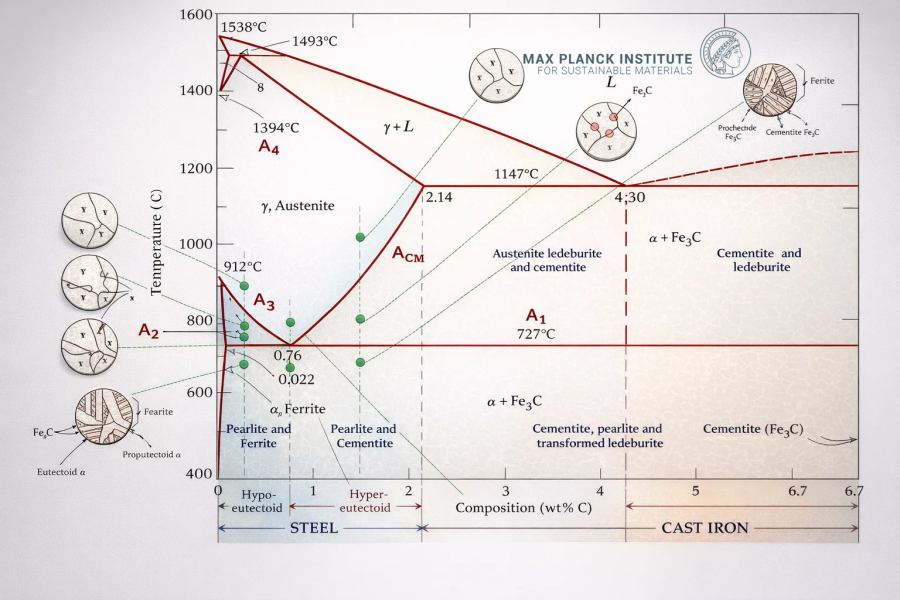
The diagram delineates five distinct phase fields—liquid, δ-ferrite, γ-austenite, α-ferrite, and cementite—bounded by three invariant reaction isotherms and multiple solubility curves that define the temperature-dependent carbon solubility in each iron allotrope.
 Introduction to the Thermodynamics of Steels: The Iron Carbon Phase Diagram
Phase Definitions of the metastable Iron Carbon Phase diagram
The Fe-Fe₃C system is a binary metastable phase diagram where cementite, despite its thermodynamic instability relative to graphite, persists due to kinetic constraints during conventional processing. The diagram's abscissa represents carbon concentration in weight percent, while the ordinate denotes temperature in degrees Celsius.
Five primary phases constitute the system:
Liquid Phase (L)
A homogeneous solution of carbon in molten iron, existing above the liquidus surface. The liquidus temperature decreases monotonically from 1538°C (pure iron) to 1147°C at the eutectic composition.
δ-Ferrite (δ)
A body-centered cubic (BCC) solid solution of carbon in high-temperature iron, stable from 1394°C to 1538°C. Maximum carbon solubility reaches 0.09 wt% at the peritectic temperature (1495°C), decreasing to negligible concentrations at lower temperatures. The lattice parameter expands with carbon interstitials, though solubility remains severely limited due to the small octahedral interstitial sites in the BCC structure.
Austenite (γ)
A face-centered cubic (FCC) solid solution representing the high-temperature polymorph of iron, stable between 912°C and 1394°C. The FCC lattice accommodates substantially higher carbon concentrations than BCC phases, with solubility ranging from 0.8 wt% at the eutectoid temperature (727°C) to a maximum of 2.14 wt% at the eutectic temperature (1147°C). Carbon occupies octahedral interstitial sites, causing lattice expansion proportional to concentration. Austenite exhibits paramagnetic behavior and possesses excellent ductility and formability.
α-Ferrite (α)
A BCC solid solution stable below 912°C, representing the room-temperature allotrope of iron. Carbon solubility is severely restricted, reaching only 0.022 wt% at 727°C and diminishing to approximately 0.00005 wt% at ambient temperature. α-ferrite transforms from paramagnetic to ferromagnetic at the A₂ temperature (768°C), known as the Curie temperature. This phase provides ductility and toughness to low-carbon steels.
Cementite (Fe₃C)
A metastable intermetallic compound with orthorhombic crystal structure (space group Pnma) containing exactly 6.67 wt% carbon. The unit cell contains 12 iron atoms and 4 carbon atoms in a complex arrangement. Cementite exhibits extreme hardness (approximately 800-1000 HV) and brittleness, serving as the primary strengthening phase in steels. It transforms from ferromagnetic to paramagnetic at the A₀ temperature (210°C).
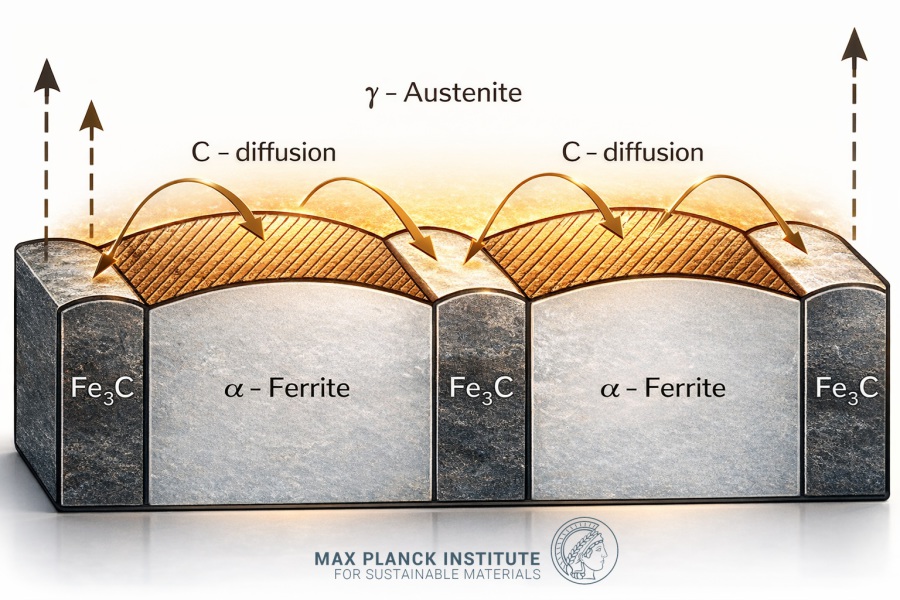 Pearlite in steel is a fundamental, layered (lamellar) microstructure made of alternating thin plates of soft, ductile ferrite (iron) and hard, brittle cementite (iron carbide), forming during slow cooling of iron-carbon alloys like steel, giving it a bal
Scientific RepoRts | 6:33228 | DOI: 10.1038/srep33228
Ultrastrong damage tolerant Scientific R[...]
PDF-Dokument [1.7 MB]
Acta Materialia 59 (2011) 3965-pearlite_[...]
PDF-Dokument [2.8 MB]
steel research int. 78 (2007) perlite te[...]
PDF-Dokument [310.6 KB]
Invariant Reactions and Critical Points of the metastable Iron Carbon Phase diagram
Three invariant reactions define the topological structure of the diagram, each occurring at fixed temperature and composition:
Peritectic Reaction (HJB Line)
Temperature: 1495°C
Composition: 0.16 wt% C
Reaction: L₀.₅₃ + δ₀.₀₉ ↔ γ₀.₁₇
Liquid phase containing 0.53 wt% carbon reacts with δ-ferrite containing 0.09 wt% carbon to form austenite with 0.17 wt% carbon. This reaction is primarily of theoretical significance, affecting only alloys with carbon content below 0.53 wt% during initial solidification.
Eutectic Reaction (ECF Line)
Temperature: 1147°C
Composition: 4.3 wt% C
Reaction: L₄.₃ ↔ γ₂.₁₄ + Fe₃C
Liquid transforms simultaneously into austenite (2.14 wt% C) and cementite, forming a lamellar mixture termed ledeburite. This reaction governs solidification in cast irons (2.11-6.67 wt% C). The resulting ledeburitic structure is extremely hard and brittle, comprising alternating layers of austenite and cementite.
Eutectoid Reaction (PSK Line/A₁)
Temperature: 727°C
Composition: 0.76-0.8 wt% C
Reaction: γ₀.₈ ↔ α₀.₀₂₂ + Fe₃C
Austenite decomposes into a lamellar aggregate of ferrite and cementite known as pearlite. This transformation fundamentally determines the mechanical properties of most engineering steels. The eutectoid composition divides steels into:
-
Hypoeutectoid steels (<0.8 wt% C): Proeutectoid ferrite forms prior to pearlite
-
Hypereutectoid steels (>0.8 wt% C): Proeutectoid cementite forms along austenite grain boundaries before pearlite formation
Critical Temperature Lines and Phase Boundaries of the metastable Iron Carbon Phase diagram
The diagram contains several characteristic lines representing phase boundaries and magnetic transformations:
A₀ Line (210°C)
Marks the Curie temperature of cementite, where Fe₃C transitions from ferromagnetic to paramagnetic behavior. This transformation is isothermal and composition-independent.
A₁ Line (727°C)
The eutectoid isotherm (PSK line) represents the lower stability limit of austenite in steels. Below this temperature, austenite is thermodynamically unstable and transforms to ferrite-cementite mixtures. This critical temperature is central to heat treatment design.
A₂ Line (768°C)
The Curie temperature of α-ferrite, where ferromagnetic α-ferrite transforms to paramagnetic β-ferrite. The crystal structure remains BCC across this transition; only magnetic ordering changes.
A₃ Line (GS)
The temperature at which hypoeutectoid steels complete transformation from ferrite-austenite mixtures to fully austenitic structure upon heating. For pure iron, A₃ occurs at 912°C, decreasing to 727°C at 0.8 wt% C. This line defines the upper critical temperature for hypoeutectoid steels.
Acm Line (ES)
The solubility limit of carbon in austenite, representing the temperature at which cementite begins to precipitate from austenite in hypereutectoid steels upon cooling. This boundary decreases from 1147°C at 2.14 wt% C to 727°C at 0.8 wt% C, defining the upper critical temperature for hypereutectoid steels.
Phase Field Regions of the metastable Iron Carbon Phase diagram and Microstructural Evolution
Single-Phase Fields
-
Liquid field: Above the liquidus surface, homogeneous molten alloy
-
δ-ferrite field: Narrow region at high temperatures and low carbon concentrations
-
Austenite field: Extensive γ-phase region crucial for hot working and heat treatment
-
α-ferrite field: Leftmost region below A₃, representing pure ferritic structure
-
Cementite field: Vertical line at 6.67 wt% C, indicating stoichiometric compound
Two-Phase Fields
-
L + δ: Solidification range for ultra-low carbon steels
-
L + γ: Primary solidification field for most steels and cast irons
-
L + Fe₃C: Hypereutectic cast iron solidification
-
γ + δ: High-temperature transformation region
-
γ + α: Hypoeutectoid steel transformation range
-
γ + Fe₃C: Hypereutectoid steel transformation range
-
α + Fe₃C: Final room-temperature structure for all steels (pearlite, bainite, martensite)
Three-Phase Equilibria
Invariant horizontal lines represent three-phase reactions where degrees of freedom become zero. The peritectic, eutectic, and eutectoid isotherms each connect three single-phase fields.
The metastable Iron Carbon Phase diagram: Quantitative Phase Analysis, Lever Rule Applications and Guidelines for Heat Treatment of Steels
Phase fractions in two-phase regions are determined via the lever rule, which applies mass balance constraints along tie-lines. For a steel of composition C₀ in the α + Fe₃C field:
Fraction of α-ferrite = (C_Fe₃C - C₀) / (C_Fe₃C - C_α)
Fraction of cementite = (C₀ - C_α) / (C_Fe₃C - C_α)
Where C_Fe₃C = 6.67 wt% and C_α = 0.022 wt% at 727°C.
Example calculation for eutectoid steel (0.8 wt% C):
Pearlite fraction = (6.67 - 0.8) / (6.67 - 0.022) = 0.88 (88%)
Proeutectoid cementite = 0.12 (12%)
For hypoeutectoid steels, the microstructure consists of proeutectoid ferrite plus pearlite, with pearlite fraction increasing linearly with carbon content until reaching 100% at the eutectoid composition.
Metastable vs. Stable Equilibrium
The Fe-Fe₃C diagram represents metastable equilibrium where cementite persists indefinitely at room temperature. The true stable equilibrium involves graphite formation according to:
Fe₃C → 3Fe + C (graphite)
This transformation is kinetically hindered at conventional cooling rates, making the metastable diagram practically relevant for conventional steel processing. In cast irons, silicon additions and slow cooling promote graphite formation, requiring consideration of the stable Fe-C (graphite) diagram.
Practical Implications in Materials Engineering
Heat Treatment Design
The diagram enables precise selection of austenitizing temperatures:
-
Hypoeutectoid steels: A₃ + 30-50°C
-
Hypereutectoid steels: Acm + 30-50°C
-
Eutectoid steels: A₁ + 30-50°C
Microstructure-Property Correlation
-
Ferrite: Provides ductility and toughness, low strength
-
Cementite: Provides wear resistance and hardness, extreme brittleness
-
Pearlite: Balanced strength and ductility through lamellar composite structure
-
Ledeburite: Characteristic of white cast irons, extremely hard and brittle
Alloy Design
Carbon content determines material classification:
-
Steels: 0.008-2.11 wt% C (ferrite + pearlite microstructures)
-
Cast irons: 2.11-6.67 wt% C (ledeburitic structures with graphite or cementite)
Limitations and Extensions
The binary Fe-Fe₃C diagram assumes equilibrium conditions and pure Fe-C binary systems. Real engineering materials contain alloying elements (Mn, Si, Cr, Ni, Mo) that:
-
Shift critical temperatures (A₁, A₃, Acm)
-
Alter carbon solubility limits
-
Form additional carbides
-
Modify transformation kinetics
Thermodynamic databases (CALPHAD method) extend the diagram to multicomponent systems, enabling computational prediction of phase equilibria in complex commercial alloys.