3D EBSD: Experiments and DAMASK Simulations coupled
A set of 3D EBSD studies investigates stress and strain partitioning in dual-phase steel using a fully measured 3D microstructure obtained via serial-sectioning EBSD and simulated through the
DAMASK crystal plasticity framework with a spectral solver. The steel consists of a ferritic matrix (average grain size 5 µm) reinforced by martensitic islands (~0.5 µm). Martensite accounts for 5.8
vol%, identified through grain-size-based segmentation due to preparation-induced EBSD image-quality variability. The constitutive description applies a phenomenological crystal plasticity model for
bcc slip (24 systems, {110} and {112} planes, 〈111〉 directions), with parameters adapted from literature.
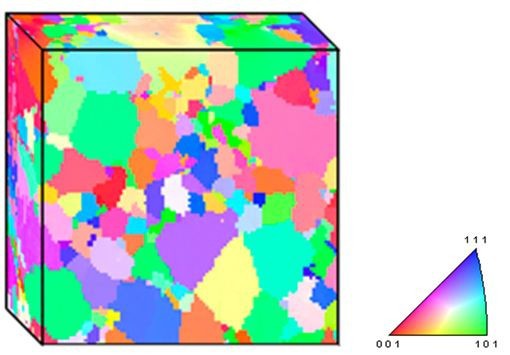
A cubic simulation cell (772 200 voxels) was mirrored in all directions to enforce periodicity. For comparison, 2D columnar models were extracted from individual EBSD slices. Uniaxial tensile loading
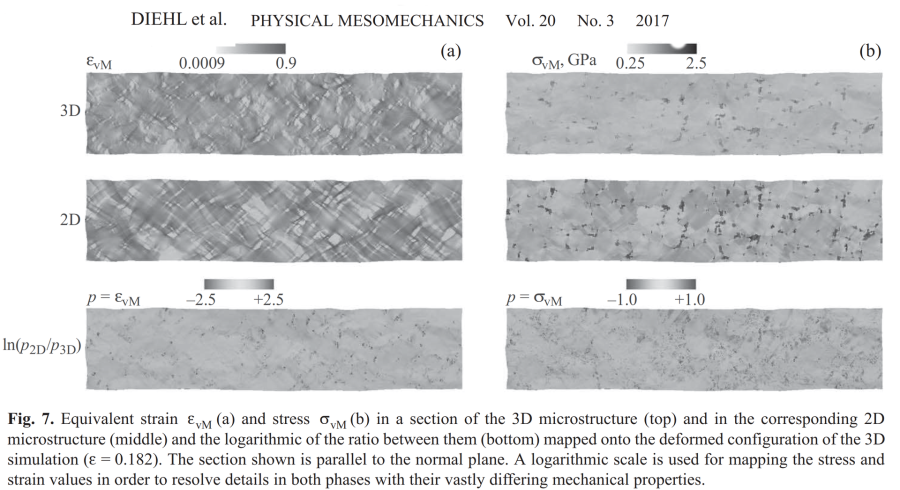
along the rolling direction (engineering strain rate 10⁻³ s⁻¹) to a true strain of 0.182 was applied.
3D simulation results:
Von Mises stress and strain maps reveal strong phase- and grain-level heterogeneity persisting throughout deformation. Martensite sustains higher stresses (mean 1.91 GPa, max 7.03 GPa) but lower
strains (mean 0.045, max 0.69) than ferrite (mean 0.67 GPa, max 1.32 GPa; mean strain 0.215, max 0.865). Stress variations span up to three orders of magnitude in martensite and two in ferrite;
strain variations are more than tenfold in martensite and order-of-magnitude in ferrite. Spatial patterns are stable with increasing load, indicating microstructurally controlled localization.
 3D EBSD study investigates stress and strain partitioning in dual-phase steel using a fully measured 3D microstructure obtained via serial-sectioning EBSD and simulated through the DAMASK crystal plasticity framework with a spectral solver.
2D vs 3D comparison: EBSD and DAMASK microstructure simulation
Global stress–strain curves differ minimally between 3D and averaged 2D responses; however, local fields differ strongly. In 2D, martensite experiences higher mean and extreme stresses (up to 11.4
GPa vs 7.03 GPa in 3D) and ferrite shows larger extreme strains (>1.25 vs 0.865). Heat maps of stress–strain probability density confirm that 2D assumptions increase martensite stresses and
ferrite strains, while reducing strain heterogeneity in martensite. Pointwise comparisons show relative deviations up to ×11 in strain and ×3 in stress for identical microstructural locations,
especially near martensite–ferrite boundaries.
Mechanistic implications:
Differences arise because 2D columnar models constrain deformation paths, eliminating out-of-plane relaxation and leading to artificial shear bands and intensified local fields. The 3D geometry
allows redistribution of strain through all spatial directions, reducing peak concentrations. Thus, 2D simplifications may be adequate for bulk-average properties but are inaccurate for local
stress/strain analysis and damage initiation predictions.
Conclusions:
• Measured 3D EBSD-based crystal plasticity simulations capture realistic stress–strain partitioning in dual-phase steel without morphological simplifications.
• 2D models can approximate global mechanical response but significantly misrepresent local fields.
• For damage modeling or micromechanistic studies, full 3D microstructures are essential to avoid large quantitative errors (stress ×3, strain ×11).
• Automated, higher-precision 3D EBSD acquisition combining grain-size and image-quality criteria could improve phase segmentation and statistical robustness.
This work demonstrates the necessity of realistic 3D microstructure incorporation in computational micromechanics of multiphase steels and provides quantitative benchmarks for the deviation
introduced by 2D modeling.
Dual phase steels are advanced high strength alloys typically used for structural parts and reinforcements in car bodies. Their good combination of strength and ductility and their lean composition render them an economically competitive option for realizing multiple lightweight design options in automotive engineering. The mechanical response of dual phase steels is the result of the strain and stress partitioning among the ferritic and martensitic phases and the individual crystallographic grains and subgrains of these phases.
Crystal plasticity study stress strain p[...]
PDF-Dokument [496.2 KB]
In another study we investigated the formation and distribution of orientation gradients and geometrically necessary dislocations (GNDs) in ultrafine-grained (UFG) dual-phase (DP) steels with varying martensite content using high-resolution electron backscatter diffraction (HR-EBSD) in 2D and 3D. Two steels were produced from 0.17%C–1.63%Mn–0.28%Si ferrite–pearlite starting material via large-strain warm deformation followed by intercritical annealing:
- 730-DP: 24 vol.% martensite, 2 vol.% cementite, ferrite grain size 1.4 µm.
- 750-DP: 38 vol.% martensite, no cementite, ferrite grain size 1.2 µm.
Microstructure–mechanical property relations
Tensile testing revealed that increasing martensite fraction reduces the elastic limit, increases yield strength (Rp₀.₂) and ultimate tensile strength (UTS) (750-DP: 1003 MPa, ~100 MPa above 730-DP),
but slightly decreases total elongation. The lower elastic limit in high-martensite steels is attributed to greater residual stresses from transformation-induced volume expansion (~2.9% at Ms),
affecting a larger ferrite fraction. Strength increments align with a rule-of-mixtures contribution from the harder martensite phase and marginal Hall–Petch strengthening due to smaller ferrite
grains.
EBSD methodology and GND quantification
EBSD was performed at 50 nm step size, ~0.3° angular resolution. Two GND density calculation approaches were used:
- Kernel Average Misorientation (KAM)-based method — directly relates local misorientations to GND density.
- Dislocation tensor-based method — calculates full Nye tensor from neighbor-to-neighbor orientation gradients with energy minimization over 16 possible {110} slip configurations in ferrite.
Both methods yielded consistent results; KAM-based estimates were slightly lower but smoother due to better statistics. A 2° misorientation threshold was applied for ferrite; higher values in martensite (up to ~5°) were excluded, slightly underestimating martensite GND density.
2D EBSD results
Orientation gradients and KAM maps revealed pronounced lattice curvature around ferrite–martensite (FM) interfaces compared to ferrite–ferrite (FF) boundaries. Average misorientation 1 µm from
boundary: 1.2° (FM) vs 0.6° (FF). Cementite particles showed negligible gradients, confirming method sensitivity. Even submicron ferrite grains adjacent to multiple martensite particles were entirely
work-hardened. GND densities in ferrite were:
- 730-DP: 1.9 × 10¹⁴ m⁻²
- 750-DP: 2.4 × 10¹⁴ m⁻²
Gradients decay from ~2.5 × 10¹⁴ m⁻² near martensite to ~2.5 × 10¹³ m⁻² in grain interiors. Image Quality (IQ) maps qualitatively supported these findings, showing gradual recovery of lattice perfection away from FM interfaces.
3D EBSD results
Serial FIB sectioning with 100 nm slice thickness allowed correlation of GND density with grain volume and martensite topology. Key trends:
- Inverse grain volume–GND relationship: smaller ferrite grains exhibit higher average GND densities due to higher interface/volume ratio.
- Proportional FM interface effect: For a given grain size, GND density scales with the fraction of grain boundary in contact with martensite. In grains <4 µm³, high FM interface coverage can fully saturate the grain with transformation-induced dislocations.
3D reconstructions confirmed that high KAM values in 2D sometimes arise from martensite located out-of-plane, and that transformation strain accommodation in ferrite is spatially inhomogeneous in all three dimensions.
We study orientation gradients and geometrically necessary dislocations (GNDs) in two ultrafine grained dual-phase steels with different martensite particle size and volume fraction (24 vol.% and 38 vol.%). The steel with higher martensite fraction has a lower elastic limit, a higher yield strength and a higher tensile strength. These effects are attributed to the higher second phase fraction and the inhomogeneous transformation strain accommodation in ferrite. The latter assumption is analyzed using high-resolution electron backscatter diffraction (EBSD). We quantify orientation gradients, pattern quality and GND density variations at ferrite–ferrite and ferrite–martensite interfaces. Using 3D EBSD, additional information is obtained about the effect of grain volume and of martensite
Mater_Science_Engin_A 527 (2010) 2738.pd[...]
PDF-Dokument [2.0 MB]
Key conclusions
- FM interfaces generate ~2× higher orientation gradients than FF boundaries.
- Martensite-induced strain accommodation is heterogeneous, but present around all martensite particles regardless of size.
- Higher martensite fraction increases ferrite GND density and yield strength.
- GND density is controlled jointly by ferrite grain size and FM interface fraction; smallest grains with high martensite contact can be fully work-hardened.
- HR-EBSD in 2D and 3D provides quantitative, spatially resolved GND data, and both KAM and dislocation tensor approaches are valid for DP steels.
Scientific Summary — 3D EBSD Grain Boundary Characterization in ECAP-Processed Cu–Zr Alloy
This study quantifies the five-parameter grain boundary character distribution (GBCD) in an ultra-fine grained Cu–0.17 wt% Zr alloy processed by eight passes of equal channel angular pressing (ECAP, route BC) followed by annealing at 650 °C for 10 min. The high boundary density of this microstructure enables robust statistical analysis. The 3D dataset was acquired via a dual-beam focused ion beam (FIB)–scanning electron microscope system with serial sectioning and electron backscatter diffraction (EBSD) mapping, covering a volume of 28 × 28 × 17 µm³ (~91 040 boundary segments, 3093 grains, ≥5° misorientation, ≥10 voxel size threshold).
Grain boundary planes were determined using three methods:
- Line segment method — reconstructs straight boundaries in 3D from voxel data, identifies triple junctions, determines normals from cross products, and classifies by misorientation and plane normal.
- Stereological method — infers boundary plane orientation from 2D EBSD traces and statistical geometry; sensitive to crystallographic texture and assumes random orientation distribution for normalization.
- Triangular surface mesh method — uses marching cubes iso-surface reconstruction to directly mesh and smooth interfacial areas in 3D.
Focus was placed on Σ3 grain boundaries (60° @ [111], Brandon criterion ±8.678°), particularly coherent twins ({111} planes on both sides). Due to Cu’s low stacking fault energy, annealing twins are energetically favored.
Results:
- Line segment method: Strong Σ3 peak at coherent twin orientation. Peak intensity ≈ 230 MRD (multiples of random distribution) at coarse discretization (9 bins/90° ≈ 10° resolution) and ≈ 1100 MRD at fine discretization (11 bins/90° ≈ 8.188° resolution). Not all Σ3 boundaries were coherent.
- Triangular surface mesh: Similar qualitative results, with coherent twin peak intensities ≈ 230 MRD (coarse) and ≈ 800 MRD (fine). Slightly lower maxima than line segment method, attributed to smoothing artifacts.
- Stereological method: Coherent twin boundaries dominated Σ3 population; coherent peak ≈ 8000 MRD (fine discretization), corresponding to ~44% coherent twin area fraction (8000/17 894). This overrepresentation is likely due to preferred <111> texture causing overestimation of the background subtraction for incoherent boundaries.
- Σ3 total area fractions: All three methods yielded comparable totals when counting both coherent and incoherent Σ3 boundaries. Coherent twin fractions diverged strongly — ~44% (stereology) vs. ~7% (3D methods).
Methodological implications:
- Texture bias in stereology: Statistical approaches may misattribute orientations in the presence of strong preferred orientations, overestimating certain boundary types.
- Alignment sensitivity in 3D methods: Misalignment between EBSD slices can broaden orientation distributions and reduce peak intensities, increasing apparent incoherent fractions.
- Angular discretization: Fine binning (~8.188°) aligns with Brandon’s criterion and better resolves CSL peaks but requires larger datasets to populate bins adequately.
Conclusions:
- The coherent Σ3 fraction in ECAP-processed Cu–Zr strongly depends on the analysis method.
- Stereological 2D EBSD analysis overestimates coherent Σ3 boundaries in textured materials, while direct 3D EBSD topological methods (line segment, triangular mesh) provide more consistent — but lower — estimates.
- For quantitative five-parameter GBCD studies in textured ultrafine-grained materials, direct 3D methods are preferable despite alignment and smoothing sensitivities.
- Method selection and binning resolution must be chosen in line with CSL deviation tolerances (Brandon criterion) and dataset size to ensure statistical robustness.
Key quantitative findings:
- Sample: Cu–0.17 wt% Zr, ECAP × 8, route BC, 650 °C/10 min anneal.
- Volume analyzed: 28 × 28 × 17 µm³; 3093 grains; 91 040 boundary segments.
- Coherent Σ3 fraction: ~44% (stereology) vs. ~7% (3D methods).
- Σ3 coherent twin MRD peaks: up to ~1100 (line segment, fine binning) vs. ~800 (triangular mesh, fine binning) vs. ~8000 (stereology, fine binning).