Tomographic characterization of texture evolution in a Cu-Zr alloy deformed by equal channel angular pressing using 3D EBSD
The crystallographic texture evolution in ultra fine grained Cu-0.17wt%Zr samples produced by equal channel angular pressing (ECAP) were analyzed using 3D orientation microscopy (serial sectioning in conjunction with electron back scatter diffraction; 3D EBSD). The tomography of the microstructure was analyzed regarding grain shape, orientation correlation, and grain boundary character distribution. The method helps to better understand the origin of the 3D heterogeneity of the spatial distribution and connectivity of the main texture components, texture gradients, and interfaces produced by ECAP processing.
Introduction
Equal channel angular pressing (ECAP) is an efficient method to produce bulk polycrystals with grain sizes in the range of several hundred nanometers via severe plastic deformation (SPD) [1-3]. The process consists of two equal cross section channels, intersecting at an angle F. A rod is pressed through the ECAP die, so that the material deforms via simple shear at the intersection plane of the two channels [1-4].
The texture evolution in ECAP materials has been investigated experimentally using X-ray diffraction (XRD) and electron back scatter diffraction (EBSD) methods [5-7] as well as theoretically by micromechanical simulations [6, 8-9]. Texture measurements via XRD provide information on the volume fraction of each orientation, but they are not capable of revealing the interfaces, the location of individual grains, or their topological connectivity. EBSD also reveals the lateral correlation between the grains and their orientation and interfaces. As ECAP imposes a heterogeneous deformation path [10-11], resulting microstructure inhomogeneities can hence be elucidated using EBSD [12-13].
The mechanical origin of texture evolution and inhomogeneity resulting from ECAP can be studied using crystal mechanical models: For instance Gholinia et al. [6] modeled the deformation texture in aluminum during ECAP using a full constraints Taylor approach. They also investigated the texture experimentally via EBSD. The textures observed in the experiments had the main components {001}<110> and {112}<110> along a partial B texture fiber (characterized by {hkl}<110>) rotated by 15°-20° about the transverse direction (TD) with respect to the texture commonly observed in face centered cubic (FCC) metals exposed to torsion. The TD rotation (TD: transverse rotation) was successfully predicted by the full constraint Taylor model [6]. The {001}<110> and {112}<110> texture components in FCC metals are stabilized by strong shear processes while under plane strain loads they are highly unstable [14-16].
Tóth et al. [8] used the flow line approach in conjunction with a viscoplastic Taylor model and a viscoplastic self-consistent polycrystal plasticity model to simulate ECAP deformation textures. The orientation distribution functions (ODF) predicted were similar to those observed for simple shear experiments with relatively small deviations to the ideal shear positions. Using a viscoplastic self-consistent approach Beyerlein et al. [9] developed a modeling framework for predicting the microstructure and texture evolution in polycrystalline materials during ECAP processing. They found that the main microstructural features such as grain size and shape distributions as well as the texture were dependent on the processing route.
Molodova et al. [5] investigated the microstructure and texture evolution of pure copper (99.95%) after ECAP processing using X-ray diffraction methods. They observed that simple shear components were developed during deformation. After higher numbers of ECAP passes (ECAP 12) the strongest component was an orientation between (15 -4 -11) <7 -26 19> and (3 -3 -4) <2 -2 3>.
In the present work we report the tomographic microstructure and texture analysis of ultra fine grained Cu-0.17wt%Zr samples obtained from ECAP. The approach is based on a 3D EBSD approach which is realized as a combination of a focused ion beam (FIB) system and a high resolution field emission scanning electron microscope [17-29].
The rationale behind using a tomographic method to characterize the texture in ECAP material is not so much to reveal the global texture (which was already done in earlier works) but rather to elucidate the relationship between the local texture, grain shape, texture component connectivity, and the crystallographic character of the interfaces in 3 dimensions at high lateral resolution of down to 100 nm step size. Such an analysis helps to better understand the material inhomogeneity and the mechanisms that lead to grain refinement during ECAP and related operations.
Experimental Procedure
ECAP sample preparation
The experiments were carried out on a Cu-0.17wt%Zr alloy. Ultra fine grained copper alloys with small amounts of Zr reveal better thermal stability with electrical conductivity of 85-95% IACS (International Annealed Copper Standard) in the aged- and 55-72% IACS in the solution annealed state [30]. As the maximum solubility of Zr in Cu is 0.17 wt. % at 972°C, the material forms Cu9Zr12 precipitates below this temperature. These impede grain boundary migration and associated phenomena such as recrystallization and grain growth. Due to the better thermal stability of this alloy with combination of good mechanical properties obtained from ultra fine grained microstructure, the alloy can be used at higher temperatures, where good mechanical properties and high electrical conductivity are required.
The as-received material was first homogenized for 12 hours at 940°C, then deformed by one ECAP pass, and subsequently annealed at 650°C for 1 hour in order to obtain a homogeneous, fully recrystallized, fine grained structure with an average grain size of 6 mm. Billets with 10mm×10mm cross-section and 60mm length were then processed by ECAP at room temperature using 4 and 8 passes, respectively, via route BC. The term route BC refers to a 90° rotation about the longitudinal axis of the billet after each pass using the same sense of rotation between the passes. After ECAP processing, samples of 10mm×4mm×1mm (after 4 ECAP passes), and 6mm×5mm×1mm (after 8 ECAP passes) were cut by spark erosion.
FIB-SEM set-up for 3D EBSD characterization
3D EBSD was conducted in a dual-beam Zeiss XB1560 microscope. The instrument is equipped with a field emission electron gun, a Ga+ ion emitter unit (FIB), and secondary electron, backscatter electron and scanning transmission electron detectors. For orientation microscopy an EBSD detector (TSL/EDAX software, Hikari S/N 1040 camera) was used. 3D EBSD proceeds by fully automated serial sectioning via the FIB and the subsequent high resolution EBSD measurements on each of the exposed layers [19, 31-34]. The FIB was operated at an accelerating voltage of 30 kV. The EBSD measurements were performed at an accelerating voltage of 15 kV. The FIB column is positioned opposite to the EBSD camera, which allows a precise and quick change of the sample from the FIB position (stage tilt of 34°) into the EBSD position (stage tilt of 0°, sample tilt of 70°) [19, 31-34].
Before starting the EBSD analysis, the samples were mechanically ground, polished, and mounted on a holder. The holder was placed on a pre-tilted stage (70°) and inserted into the microscope. At first the sample was aligned for EBSD analysis. Then the stage was tilted into the FIB position (36°). After identifying the SEM and FIB beam cross-over point, the FIB position was saved. In order to find the precise position after every new cycle a position marker (cross) was milled on the sample surface close to the actual measurement area. This cross was detected at the beginning of each new milling process. For sectioning with the FIB the FIB image drift correction program is required. The position marker was detected by an image cross correlation and the sample was brought to its reference position using beam shift correction. At this stage the milling field was defined. In order to prevent shadowing during the EBSD measurements from the side walls of the measured area, the side walls were milled with a current of 2nA for samples after 2 , 4 and 8 ECAP passes, so that the investigated area were bounded by 55° side walls. After finishing the milling process, the sample was tilted into EBSD position and the CCD camera was inserted into the chamber. Both, for the FIB and EBSD positioning, the marker was first detected at the beginning of each measurement. For changing between milling and EBSD position the stage should be accurately controlled by a 3D measurement program. Further information about the fully automatic 3D EBSD method is given in [31-34]. The number of slices was set to 122, 110 and 103 for ECAP samples after 2, 4 and 8 ECAP passes, respectively. The distance between slices was 100 nm for samples after 2 ECAP passes and 50 nm for 4- and 8- ECAP passes.
The total volume investigated was (mm)3, (mm)3 ,and 3980 (mm)3 for the ECAP samples after 2 passes (with an in-plane step size of 100 nm) , 4 passes (with an in-plane step size of 50 nm) and 8 passes (with an in-plane step size of 50 nm), respectively.
3D data analysis
In order to analyze the 3D microstructure from the EBSD data set, the EDAX-TSL OIM analysis software package was used. All 2D data sets were cleaned using two clean up algorithms. First ‘CI standardization’ was executed. This algorithm assigns to each pixel within recognized grains the highest confidence index (CI) value without changing the orientation of the pixels. The CI parameter is calculated during automated indexing of the diffraction patterns. The software ranks several possible orientations, which satisfy the diffraction bands, using a voting scheme. The confidence index is based on the voting scheme and is given as CI. The second algorithm ‘CI correlation’ assigns to the pixels with a CI value below a defined minimum the orientation of the highest CI value in its neighborhood. The alignment of the 2D EBSD data sets for 3D reconstruction was conducted using a cross-correlation algorithm based on Fast Fourier Transforms (FFT). The FFTs were calculated on the inverse pole figure (IPF) maps images. The average shift was calculated on the red, blue, and green channels in IPF images. In this method two functions which only differ in a shift along the x- or the y-direction are used. The cross correlation formula uses one function along the x- or y-direction and calculates the integral of their product by each possible amount of shifting. This integral is maximized when the shift is such that similar structures line up. The Procedure of alignment was performed using the EDAX-TSL analysis software. After the first alignment procedure another alternative alignment algorithm was used which minimizes the disorientation between corresponding voxels between adjacent layers afterwards? The code was developed at Carnegie Mellon University by the group of Rohrer and Rollett [27-29].
Results and Discussion
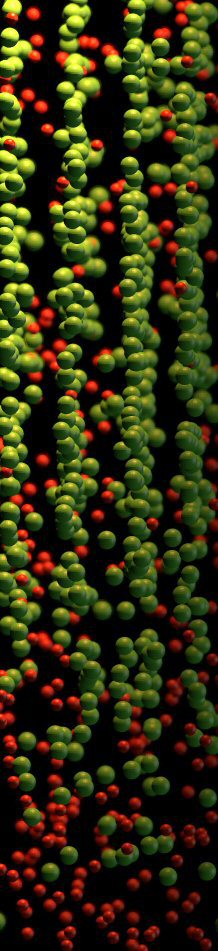
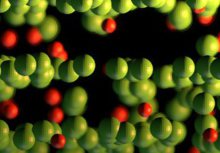
Fig. 1 shows the tomographic reconstruction of the texture in inverse pole figure coding after 2, 4 and 8 ECAP passes. The 2D EBSD measurements were performed on the extrusion plane (ED) planes, i.e. the plane normal direction for each measurement was the extrusion direction (ECAP direction). The inverse pole figure colors indicate the Miller indices of directions parallel to that ED plane. Elongated grains can be seen on both microstructures within the TD plane, particularly in the 8-pass ECAP specimen. In order to make sure that the elongated grain shapes are not caused by incorrect alignment, corresponding 2D EBSD measurements were additionally carried out within the TD plane of the 8-pass ECAP sample. The 2D inverse pole figure map of this measurement is shown in Fig. 2. It confirms that the grain shapes obtained from TD sections in the 3D reconstruction are correct.
The EBSD measurement was performed with more than 90% correctly indexed points at a confidence index value above 0.1 before cleaning up for the 2-pass ECAP sample and over 80% for the 4- and 8-pass ECAP sample. The decrease of the indexing grade with increasing number of passes results from the increasing of the defect density inherited by ECAP.
Elongated grains in ECAP samples were already reported by other authors [11, 35-38]. The deformation in ECAP is achieved through simple shear deformation on the intersection plane of the two ECAP channels which has an angle of 45° to the extrusion direction (ED) direction. The elongated grains are the result of the shearing within that shear plane. On the ED plane the grains appear with a more equiaxed and globular shape. Fig. 1 also shows that the grain size decreases with increasing the ECAP passes. Zhu et al. have discussed the grain refinement mechanisms in ECAP deformation via rout BC in FCC metals [39]: One of the most important features of ECAP processing is that the material can undergo very high strains by repetitive pressing owing to the cross-section preserving strain path. In this procedure the subgrain boundaries tend to gradually form into high angle grain boundaries through accumulation and absorption of dislocations [39]. This procedure produces ultra-fine grains that are separated by high angle grain boundaries. In ECAP processing route BC is the most effective route for producing ultra fine grains [39-41].
In order to investigate the gradual deformation-stimulated formation of high angle grain boundaries in the current 3D case we analyzed the amount of high angle grain boundaries (misorientation above 15°) and low angle grain boundaries (misorientation between 2° and 15°) in all three specimens (2-, 4- and 8-pass ECAP, Fig. 3). For this purpose we calculated the length of the high angle grain boundaries in the measured volume and divided it by the total length of all grain boundaries in the 3D microstructure. The same calculation was made for the low angle grain boundaries. Fig. 3 shows that with increasing number of ECAP passes the fraction of high angle grain boundaries increases from about 25% (2-pass) to 65% (8-pass).
Fig. 4 shows 300 randomly selected grains from the 3D EBSD data set of the 8-pass ECAP sample (EBSD step size: 50 nm). The 3D reconstruction is performed after alignment of the data set using the algorithm from the group of Rohrer and Rollett [27] in conjunction with the Open DX free software. The topography reveals both equiaxed grains (examples shown with black dashed arrows) and more elongated grains (examples shown with red dashed arrows). This presentation of some randomly picked crystals in 3D reveals that the microstructure is not homogeneous after 8 ECAP passes. Fig. 5 shows the distribution of normalize grain volume calculated from the 3D measurement of the sample after 2, 4 and 8 ECAP passes. The grains are defined with a tolerance angle of 5° and cutoff size of 10 voxels. The mean grain volume of the microstructure is about 8.8 × 10⁵ [nm3].
Crystallographic Texture
Depending on the stacking fault energy of FCC metals the deformation mode can change from {111} <110> slip to slip plus twinning. In Cu-0.17wt%Zr, after 4 and 8 ECAP passes, the volume fraction of the twin grain boundaries calculated from the 3D EBSD data is about 1.9% and 3.7%, respectively. This result shows that the amount of twin interfaces increases with the strain, but the volume fraction of twins after 8 ECAP passes is still low which indicates that the main deformation mechanism in both samples is dislocation slip. Fig. 6 gives an illustration of the ECAP die (F=90°). The ECAP textures are presented in the X-Y-Z coordinate system. The shear deformation is indicated by the X´-Y´-Z´ coordinates. The shear plane is parallel to the X´-Z´ plane [26]. In order to represent the ideal shear texture components in the X-Y-Z system they should be rotated 45° around the Z axis, which means a 45° rotation in j1 direction (Fig. 6) [8, 40]. In the X-Y-Z system an orientation of {hkl} <uvw> is an orientation with {hkl} parallel to y-direction and <uvw> parallel to x-direction.
During ECAP deformation the {111} planes tend to become aligned parallel to the shear plane. This plane has in the current ECAP set-up an angle of 45° to the ED direction. As the ECAP deformation can be approximated by simple shear, the corresponding ideal shear texture components of ECAP samples match those observed in simple shear experiments rotated by 45° as explained above [5, 8, 35, 43,44]. Ideal simple shear textures can be represented by two fibers, the A-fiber {111}<uvw> and the B-fiber {hkl}<110> [45,46] (see Table 1). These texture fibers have in common the crystallographic slip direction parallel to the shear direction and a crystallographic slip plane parallel to the shear plane, respectively [20]. The components of the ideal shear texture after a 45° rotation are listed in Table 1.
Fig. 7 shows the orientation distribution functions for three samples (after 2, 4 and 8 ECAP passes) as obtained from the 3D EBSD data. Conventionally, ODF determination is conducted by the measurement of several XRD (X-ray diffraction) pole figures. These calculations can lead to series expansion inaccuracies (in case of Fourier expansions) or under-determined equation systems (in case of direct inversions) which can be avoided when a microtexture technique such as 2D EBSD is used to obtain the orientation distribution. While both, XRD and 2D EBSD are surface-sensitive methods, in the 3D EBSD technique we sequentially removed layers of 50 nm or 100nm thickness, respectively and hence obtained a volume-integrated measure of the orientation distribution. This is of great importance for studying the texture with respect to orientation gradients or inhomogeneities resulting from incomplete grain refinement in ECAP materials. Orientation distribution functions of the sample after 2 ECAP passes, 4 ECAP passes and 8 ECAP passes were calculated from the 3D EBSD data set using the harmonic series expansion method. Only the j2=45° sections are presented. For comparison the main ECAP texture components commonly observed in previous works on FCC polycrystals are listed in Table 1 and included in the j2=45° sections. The red dots in Fig.7 indicate the locations of the ideal shear texture components in the ECAP reference system. For comparison Fig. 8 shows the ODFs obtained via XRD measurements and subsequent series expansion.
Wright et al. [48] suggest that approximately 10,000 grains produce a good sampling in rolled steel and threaded steel rods for obtaining a statistically robust ODF. In the current work the number of grains in the 3D EBSD data sets is 9518 in case of the 4-ECAP sample and 22,939 for the 8 ECAP sample. Fig. 7 reveals deviations between the ideal shear texture components, given in Table 1, and the ODF data that were derived from the 3D EBSD data sets. Such deviations between ideal shear components and experimental ECAP textures were observed before. They were attributed to the geometry of the deformation process, strain hardening, through-thickness gradients, and friction conditions [5, 8, 35, 43].
|
j1 |
|
j1 |
For the 2-passes ECAP sample a maximum occurs at an orientation close to AE. table 1. In the other two samples (after 4 and 8 ECAP passes) the orientation close to A*1E is strong. It can be seen that a maximum also occurs at the orientation BE for the 4-passes ECAP sample. In route BC a shear reversal occurs, i.e. the third pass imposes the reverse shear relative to the first pass and this strain path change is repeated every four passes. Owing to this symmetry relationship, we expect that the orientation with the maximum orientation density should be similar for samples after 4 and 8 ECAP passes. This effect is indeed observed, i.e. the maximum orientation density of the main shear component is 10.8 after 4 ECAP passes and it increases to 12.5 after 8 ECAP passes.
The CE orientation (225° 90° 45°) is developed after 8 ECAP passes while after 4 ECAP passes the CE orientation is weak, Fig. 7. Li et al. [36] studied the texture evolution in pure copper processed by ECAP via route BC and found that the strongest component after 4 and 8 ECAP passes was an orientation near to the A*1E component [36]. Molodova et al. [5] found the maximum orientation density between the components BE and CE for pure copper after 4 and 8 ECAP passes via route BC [5].
We attribute the difference between our observations and the results from pure copper to the existence of a second phase in the current alloy. Due to the Cu9Zr2 precipitations in the microstructure, localization of strain occurs and consequently shear bands develop. Another reason is the starting texture which generally affects the texture evolution. In our study the texture component with the maximum orientation density found in XRD measurements was an orientation between BE and CE (Fig. 8) after 2, 4 and 8 ECAP passes.
The comparison of the ODFs obtained from the 3D EBSD data sets with those obtained by XRD reveals some deviations which we attribute to the fact that the ECAP process does not lead to a homogeneous deformation but to texture gradients through the thickness. While the 3D EBSD data provide a through-thickness integration of the texture, the XRD data are surface sensitive.
The occurrence of texture gradients is documented in Fig. 9 which provides the ODFs of three different through-thickness slices for both samples (4 ECAP passes, 8 ECAP passes). The chosen ODFs in three different slices for each sample demonstrate that the samples are characterized by texture gradients both with respect to the position and orientation density of the texture components. For the 4-pass ECAP sample the strongest component is an orientation between BE and CE at a distance of 1 mm from the surface. At 4 mm from the surface an orientation between BE and A*2E appears as the strongest component in this specimen. At 7.5 mm from the surface again an orientation between BE and CE has the highest orientation density.
In the 8-pass ECAP sample the texture gradients between the different material slices are much weaker than in the 4-pass ECAP sample, i.e. the texture becomes more homogenous as the number of ECAP passes increases. In the 8-pass ECAP sample an orientation between BE and A*2E is the strongest texture component with an almost constant orientation density of about 10, Fig. 9.
Fig. 10 shows the fractions of different texture components in the volume that was characterized by 3D EBSD using a tolerance angle of 10°. This value was selected due to the scatter width of the components in the ODF under the constraint of avoiding overlap. The volume fractions of the A*1E and A*2E components along the A-fiber increase compared to the other components on this fiber while on the B-fiber the CE component is the only one that became more pronounced after 8 ECAP passes. According to earlier findings [45] the CE component was also reported to become stronger at true strains above 4.
Figs. 11, 12 and 13 show the 3D spatial distribution of the two A1E*, CE and AE components for both specimens. Slightly elongated grains still prevail even after 8 ECAP passes. The distribution of the ECAP texture components A1E* and CE after 8 ECAP passes is more homogenous than after 2 and4 ECAP passes, documenting the gradual homogenization of the microstructure through an increased number of ECAP passes. However, pronounced spatial 3D correlations among grains of the same orientation do not evolve.
Summary
The microstructure developed by ECAP processing is characterized by a high degree of inhomogeneity. For this purpose we studied the microstructure evolution on this material via 3D EBSD focusing on texture gradients in a Cu-0.17wt%Zr alloy, processed by 4 and 8 ECAP passes, respectively. We observed that the sample which was processed by 4 passes showed more pronounced texture gradients than the sample which was processed by 8 passes. The strong shear textures that are typical of the ECAP process were similar to those that were reported before.
References
[1] V.M. Segal, Mater. Sci. Eng. A 197 (1995) 157.
[2] R.Z. Valiev, E.V. Kozlov, Yu. F. Ivanov, J. Lian, A.A. Nazarov and B. Baudelet, Acta Metall. Mater. 42 (1994) 2467.
[3] A. Mishra, V. Richard, F. Gregori, R.J. Asaro and M.A. Meyers, Mater. Sci. Eng. A 410/411 (2005) 290.
[4] Y.T. Zhu and T.C. Lowe, Mater. Sci. Eng. A 291 (2000) 46.
[5] X. Molodova, G. Gottstein, M. Winning, R.J. Hellmig, Mater. Sci. Eng. A 460 (2007) 204.
[6] A. Gholinia, P. Bate, P.B. Prangnell, Acta Mater. 50 (2002) 2121.
[7] S.C. Wang, M.J. Starink, N. Gao, C. Xu and T.G. Langdon, Rev. Adv. Mater. Sci. 10 (2005) 249
[8] L.S. Tóth, R.A. Massion, L. Germain, S.C. Baik, S. Suwas, Acta Mater. 52 (2004) 1885.
[9] I.J. Beyerlein, R.A. Lebensohn, C.N. Tomé, Mater. Sci. Eng. A 345 (2003) 122.
[10] P.B. Prangnell, J.R. Bowen, P.J. Apps, Mater. Sci. Eng. A 375-377 (2004) 178.
[11] W.Q. Cao, A. Godfrey, Q. Liu, Mat. Sci. Eng. A 361 (2003) 9.
[12] D.J Dingley, V. Randle.J, Mater. Sci. 27 (1992) 4545.
[13] F.J. Humphreys, J. Micro, J. Micros. 195 (3) 170.
[14] J. Hirsch, K. Lücke, Acta Metall. 36 (1988) 2883.
[15] L.S. Tóth, P. Gilormini, J.J. Jonas, Acta Metall. 36 (1988) 3077.
[16] D. Raabe, Z. Zhao, S.–J. Park, F. Roters: Acta Mater. 50 (2002) 421.
[17] S. Zaefferer, Mater. Sci. Forum 495/497 (2005) 3.
[18] M. Groeber, B. Haley, M. Uchic, S. Ghosh, in: S. Ghosh, J. Castro, J.K. Lee (editors), Materials processing and design: modeling, simulation and application. Proc NUMIFORM 2004 (AIP Conference Proceedings). Melville, NY, USA: AIP Publishers; (2004) 1712.
[19] J. Konrad, S. Zaefferer, D. Raabe, Acta Mater. 54 (2006) 1369.
[20] M. Uchic, M. Groeber, D.M. Dimiduk, J.P. Simmons, Scripta Mater. 55 (2006) 23.
[21] M.Z. Quadir, N. Mateescu, L. Bassman, W. Xu, M. Ferry, Scripta Mater. 57 (2007) 977.
[22] M. Groeber, S. Ghosh, M.D. Uchic, D.M. Dimiduk, Acta Mater. 56 (2008) 1257.
[23] M.A. Groeber, B.K. Haley, M.D. Uchic, D.M. Dimiduk, S. Ghosh, Mater. Char. 57 (2006) 259.
[24] W. Xu, M. Ferry, N. Mateescu, J.M. Cairney, F.J. Humphreys, Mater. Charact. 58 (2007) 961.
[25] W. Xu, M. Ferry, J.M. Cairney, F.J. Humphreys, Acta Mater. 55 (2007) 5157.
[26] D.J. Rowenhorst, A. Gupta, C.R. Feng, G. Spanos, Scripta Mater. 55 (2006) 11.
[27] A.D. Rollett, S.-B. Lee, R. Campman, G.S. Rohrer, Ann. Rev. Mater. Res. 37 (2007) 627.
[28] S.J. Dillon, G.S. Rohrer, Accepted in J. Am. Ceram. Soc. (2009).
[29] S.J. Dillon, S.-B. Lee, A.D. Rollett, G.S. Rohrer, Microsc Microanal 14 (suppl 2) (2008), 987.
[30] X. Molodova, A. Khorashadizadeh, G. Gottstein, M. Winning, R.J. Hellmig, Int. J. Mat. Res. 98 (2007) 4.
[31] S. Zaefferer, S. I. Wright, D. Raabe, Metall. Mater. Trans. A 39 (2008) 374.
[32] E. Demir, D. Raabe, N. Zaafarani, S. Zaefferer: Acta Mater. 57 (2009) 559.
[33] N. Zaafarani, D. Raabe, F. Roters and S. Zaefferer: Acta Mater. 56 (2008) 31.
[34] A. Bastos, S. Zaefferer, D. Raabe: Journal of Microscopy 230 (2008) 487.
[35] S. Li, I.J. Beyerlein, C.T. Necker, D.J. Alexander, M. Bourke, Acta Mater. 52 (2004) 4859.
[36] S. Li, I. J. Beyerlein, D.J. Alexander, S.C. Vogel, Acta Mater. 53 (2005) 2111.
[37] S. Ferrassse, V.M. Segal, F. Alford, Mater. Sci. Eng. A 372 (2004) 235.
[38] H. Mughrabi, H.W. Höppel, M. Kautz, R.Z. Valiev, Z. Metalkd. 94 (2003) 1079.
[39] Y.T. Zhu, T.C. Lowe, Mater. Sci. Eng. A 291 (2000) 46.
[40] Y. Iwahashi, Z. Horita, M. Nemoto, T.G. Langdon, Acta Mater. 46 (1998) 3317.
[41] Y. Iwahashi, M. Furukawa, Z. Horita, M. Nemoto, T.G. Langdon, Metall. Mater. Trans. 29A (1998) 2245.
[42] S. Li, I.J. Beyerlein, M. A.M. Bourke, Mater. Sci. Eng. A 394 (2005) 66.
[43] S. Suwas, L.S. Tóth, J. Fundenberger, A. Eberhardt, W. Skrotzki, Scripta Mater. 49 (2003) 1203.
[44] A.A. Gazder, F. Dalla Torre, C.F. Gu, C.H.J. Davies, E.V. Pereloma, Mater. Sci. Eng. A 415 (2006) 126.
[45] G. R. Canova, U. F. Kocks, J. J. Jonas, Acta Metall. 32 (1984) 211.
[46] M. Hölscher, D. Raabe, K. Lücke, Acta Metall. Mater. 42 (1994) 879.
[47] A. Khorashadizadeh, RWTH Aachen, Master thesis (2007).
[48] S.I. Wright, M. M. Nowell and J. F. Bingert, Metal. Mater. Trans. A 38 (2007) 1845.
 after 4 ECAP passes and (b) after 8 ECAP passes")
 in two dimensions.")

 in the 3D reconstructed microstructure of the 8-pass ECAP sample mapped with an in-plane step size of 50 nm.")
 2, b) 4 and C) 8-passes ECAP samples with an in-plane step size of 100 nm, 50 nm and 50 nm, respectively.")

 after 2 ECAP passes b) after 4 ECAP passes and c) after 8 ECAP passes (route BC).")
 after 2 ECAP passes and b) after 4 ECAP passes C) after 8 ECAP passes, obtained from XRD measurements and subsequent series expansion")
 1 m, b) 2 m and c) 3.5 m from the surface.")
 in the measured volume via 3D EBSD measurements.")
 (1 1 8) <4 4 1> in the measured volume a) after 2 ECAP passes, b) after 4 ECAP passes and c) after 8 ECAP passes.")
 (3 -3 4) <2 2 3> in the measured volume a) after 2 ECAP passes, b) after 4 ECAP passes and c) after 8 ECAP passes.")
 (9 -1 4) <1 11 5> in the measured volume a) after 2 ECAP passes, b) after 4 ECAP passes and c) after 8 ECAP passes.")
ADVANCED ENGINEERING MATERIALS 2011, 13, No. 4
ADV ENGIN MATER 2011 3D-EBSD copper ECAP[...]
PDF-Dokument [749.6 KB]
Journal of Microscopy, Vol. 230, Pt 3 2008, pp. 487–498
Journal of Microscopy 230 (2008) 487–498[...]
PDF-Dokument [667.5 KB]
Acta Materialia 60 (2012) 1623–1632
Acta Materialia 60 (2012) 1623-Mo-polycr[...]
PDF-Dokument [1.6 MB]
Sci. Technol. Adv. Mater. 9 (2008) 035013 (
Sci Technol Adv Mater 9 (2008) 0350133D [...]
PDF-Dokument [1.1 MB]
Materials Science and Engineering A 527 (2010) 2738–2746
Mater_Science_Engin_A 527 (2010) 2738.pd[...]
PDF-Dokument [2.0 MB]
Acta Materialia 54 (2006) 1369–1380
Acta Materialia 54 (2006) 1369–1380 3D E[...]
PDF-Dokument [902.4 KB]
Acta Materialia 57 (2009) 559–569
Acta Materialia 57 (2009) 559 indent.pdf
PDF-Dokument [1.9 MB]
VOLUME 39A, FEBRUARY 2008 METALLURGICAL AND MATERIALS TRANSACTIONS A
3D EBSD overview Metall Mater Trans A vo[...]
PDF-Dokument [1.0 MB]